Peak time reports
Updated at 2026-07-26
Use Peak Times reports to schedule coverage around the days and hours when customers are most active.
Open the Peak Times report
In the main left menu, open Statistics, then select Peak Times. The page is titled Peak Times Statistics.
Find busy periods
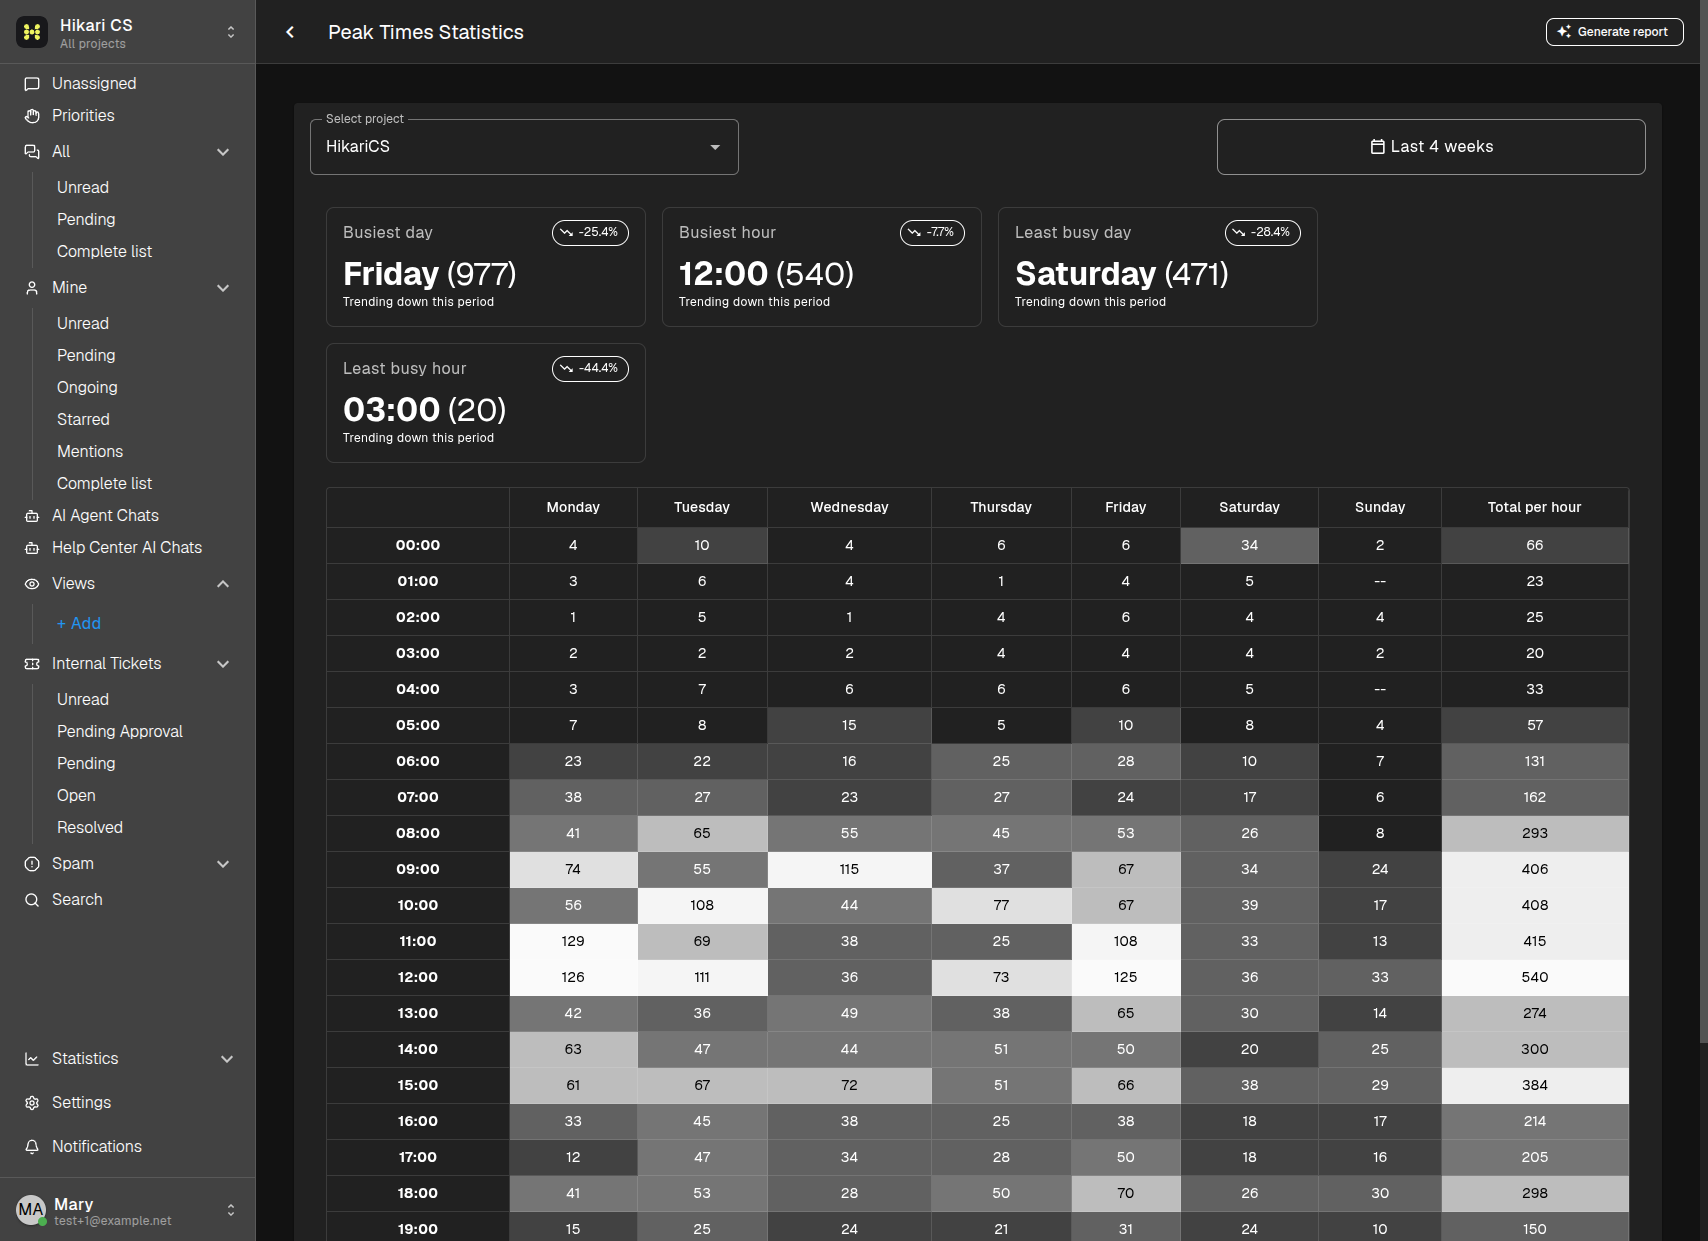
Choose a project and date range. The report compares each highlighted value with the previous period of the same length.
The summary cards identify:
- Busiest day - the day of the week with the most conversations.
- Busiest hour - the hour with the most conversations.
- Least busy day - the day of the week with the fewest conversations.
- Least busy hour - the hour with the fewest conversations.
The activity table shows every hour against each day of the week. Darker cells represent relatively busier periods. Use the row and column totals to compare the overall volume by hour or day. Empty cells display -- when no data is available.
Generate an AI report
Click Generate report in the top-right corner to create an AI Pro analysis for the selected project and period. The button remains unavailable while the report is being prepared.
When it is complete, click View report to read it in the drawer. You can select Download Report to save the report as a Markdown file. Close the drawer with X before you generate another report.
Summary
- Select Statistics > Peak Times.
- Use the summary cards and activity table to plan team coverage.
- Generate an AI report when you need a written analysis of demand patterns.