How to use product issue reports
Updated at 2026-07-26
Product issue reports give you an aggregated view of the problems reported across your Shopify-connected projects. You can explore trends by issue type, product, category, tag, or resolution, and generate an AI-powered report for deeper insights. Set up product issue reporting before using this report.
Open the Issue Statistics page
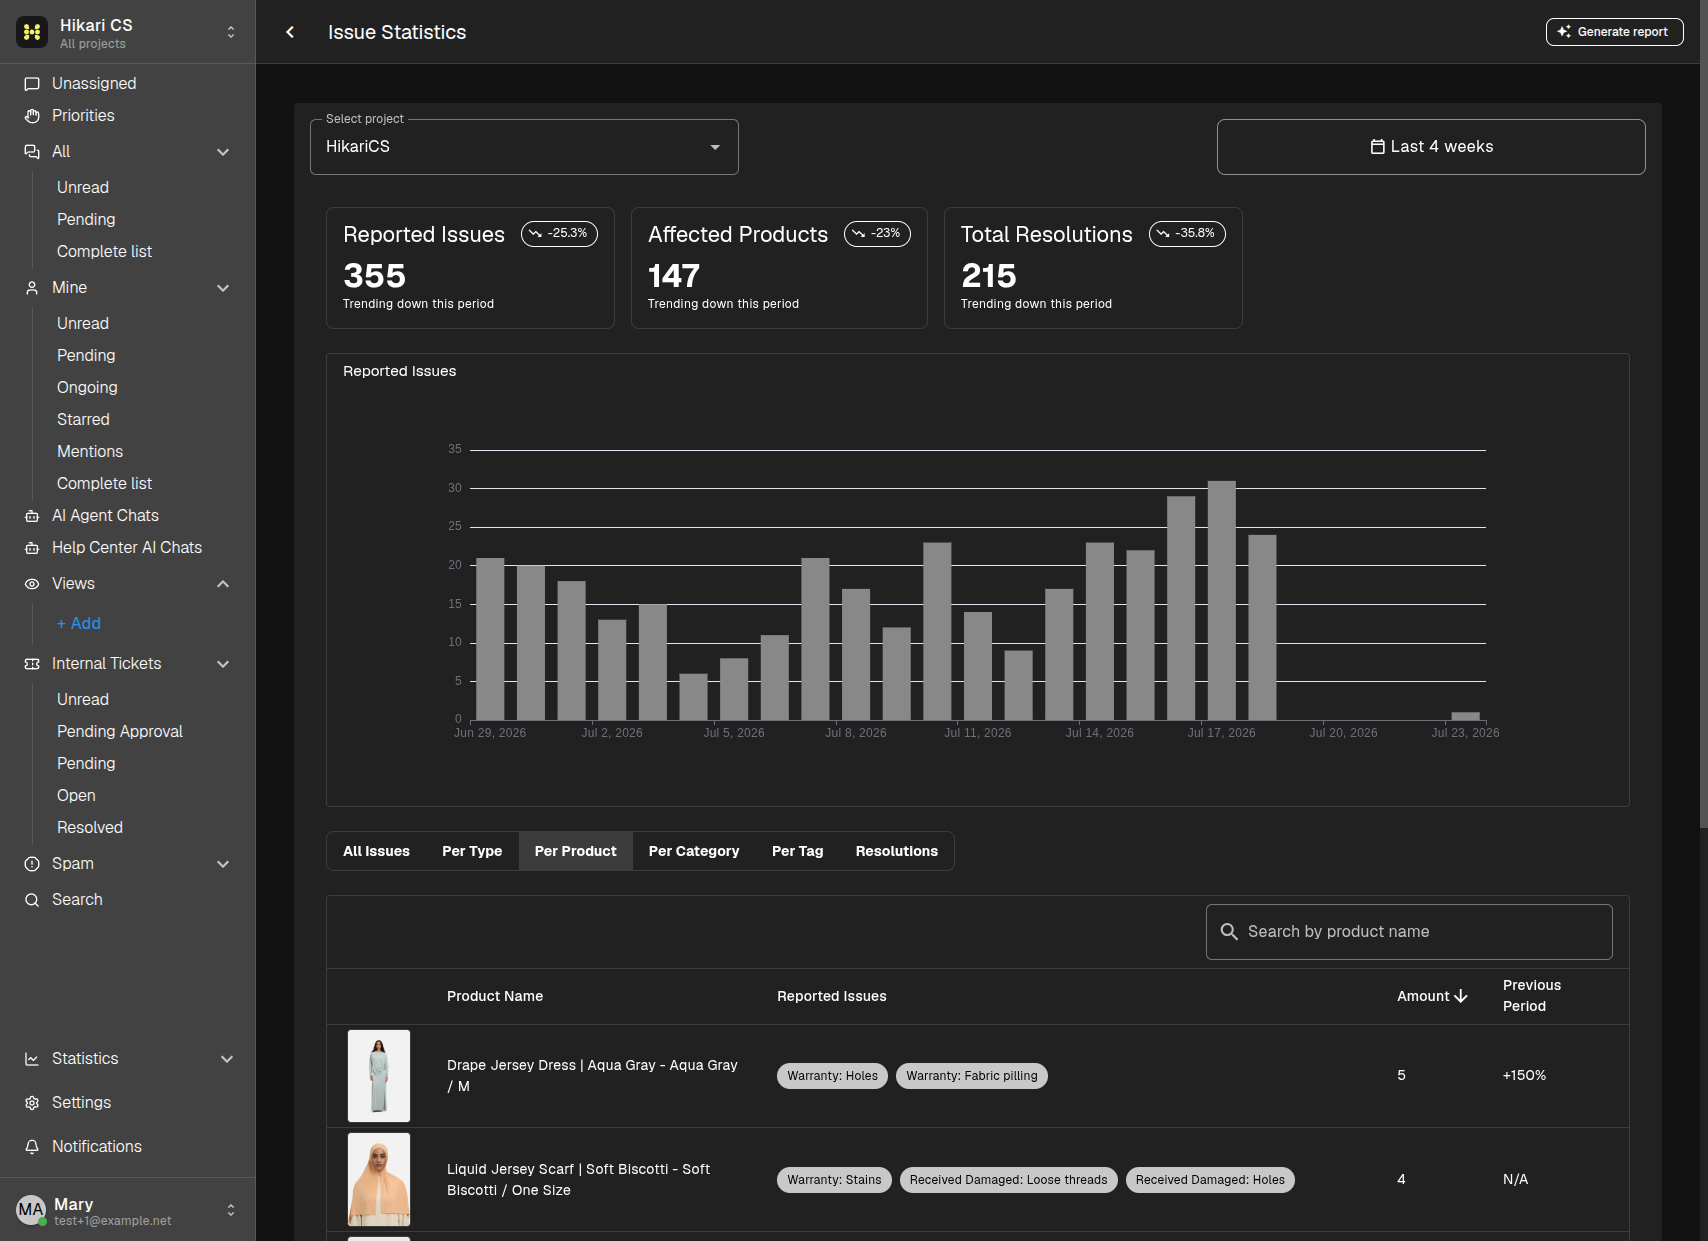
Go to Statistics in the main left menu, then click Reported issues. The page opens with the title Issue Statistics.
Filter by project and date range
At the top of the page:
- Use the Select project dropdown to choose the project you want to analyze.
- Use the date range selector to set the reporting period.
The dashboard updates to show key metrics for the selected period. Each change is compared with the immediately preceding period of the same length:
- Reported Issues — total issues logged.
- Affected Products — distinct products with reported issues.
- Total Resolutions — issues that have a resolution set.
Explore the data
Below the KPI cards, use the tabs to switch views:
- All Issues — overview of all reported issues.
- Per Type — breakdown by issue type.
- Per Product — products with the most reported issues.
- Per Category — issues grouped by product category.
- Per Tag — issues grouped by tags.
- Resolutions — breakdown by how issues were resolved.
Use the search box to find a specific item in the current view. In Per Type, Per Product, and Resolutions, select a row to open All Issues filtered to that type, product, or resolution. Click a conversation ID in All Issues to open the related conversation.
Generate an AI report
To create an AI-generated summary of the issues:
- Click Generate report in the top-right corner.
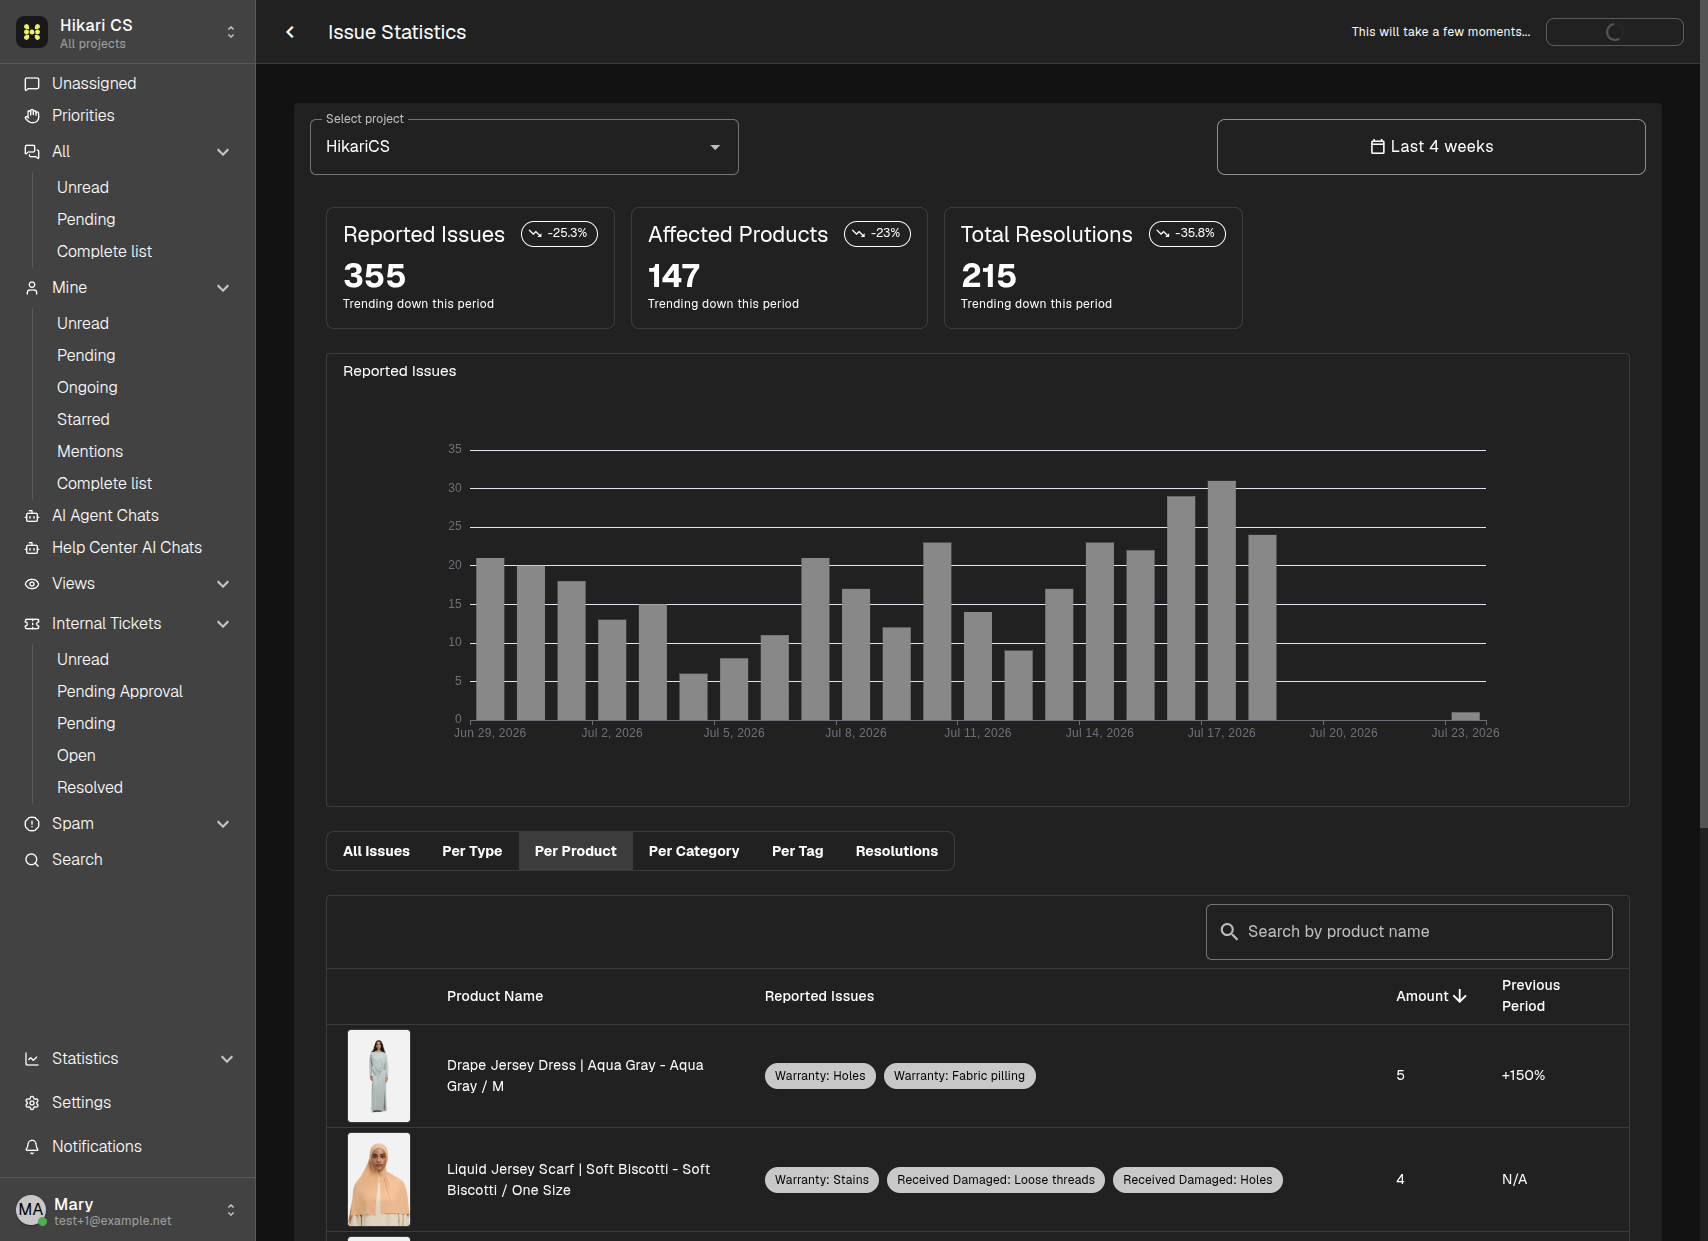
- Wait a few moments while the report is created. A "This will take a few moments..." message appears, and the button is disabled during generation.
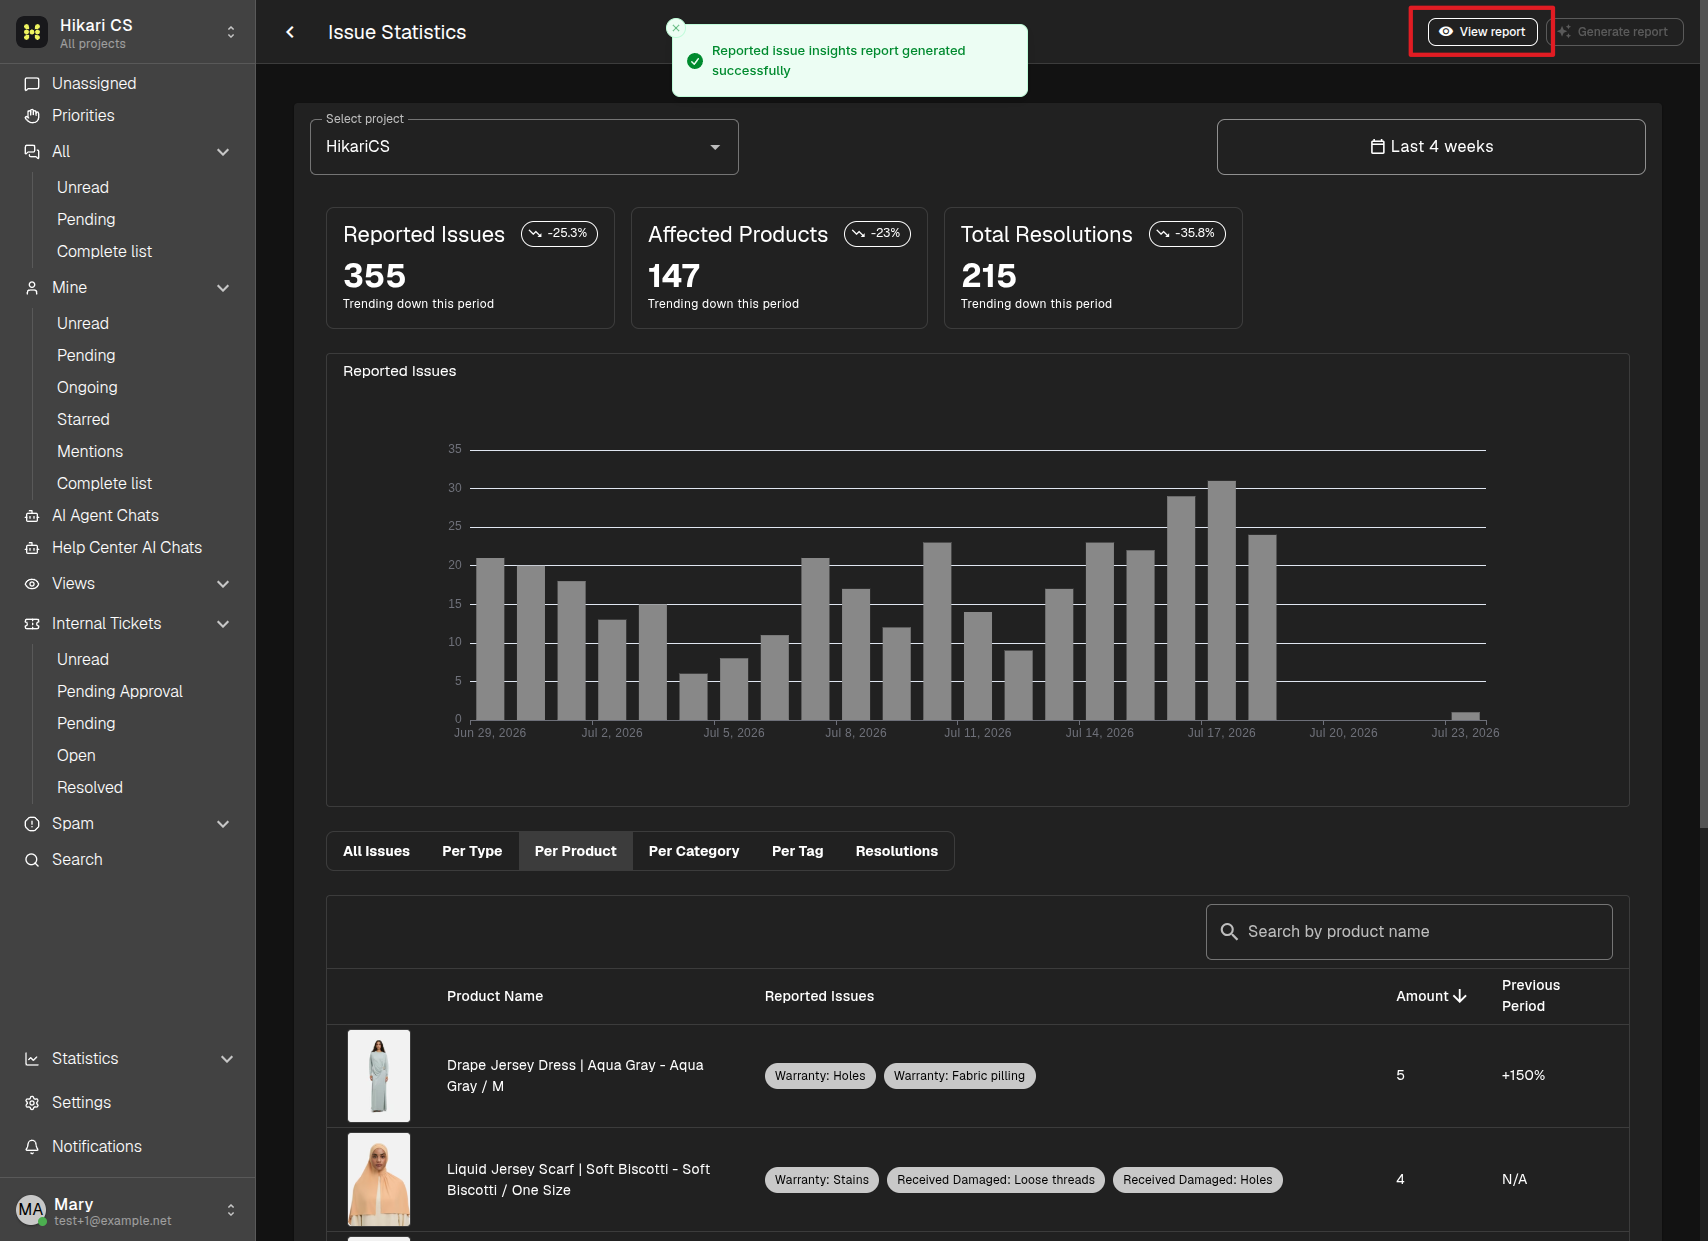
- Once ready, a View report button appears.
View and download the report
Click View report to open the report in a drawer. The report includes an executive summary, period overview, issue volume and timing, quality themes, product hotspots, resolution patterns, and recommendations.
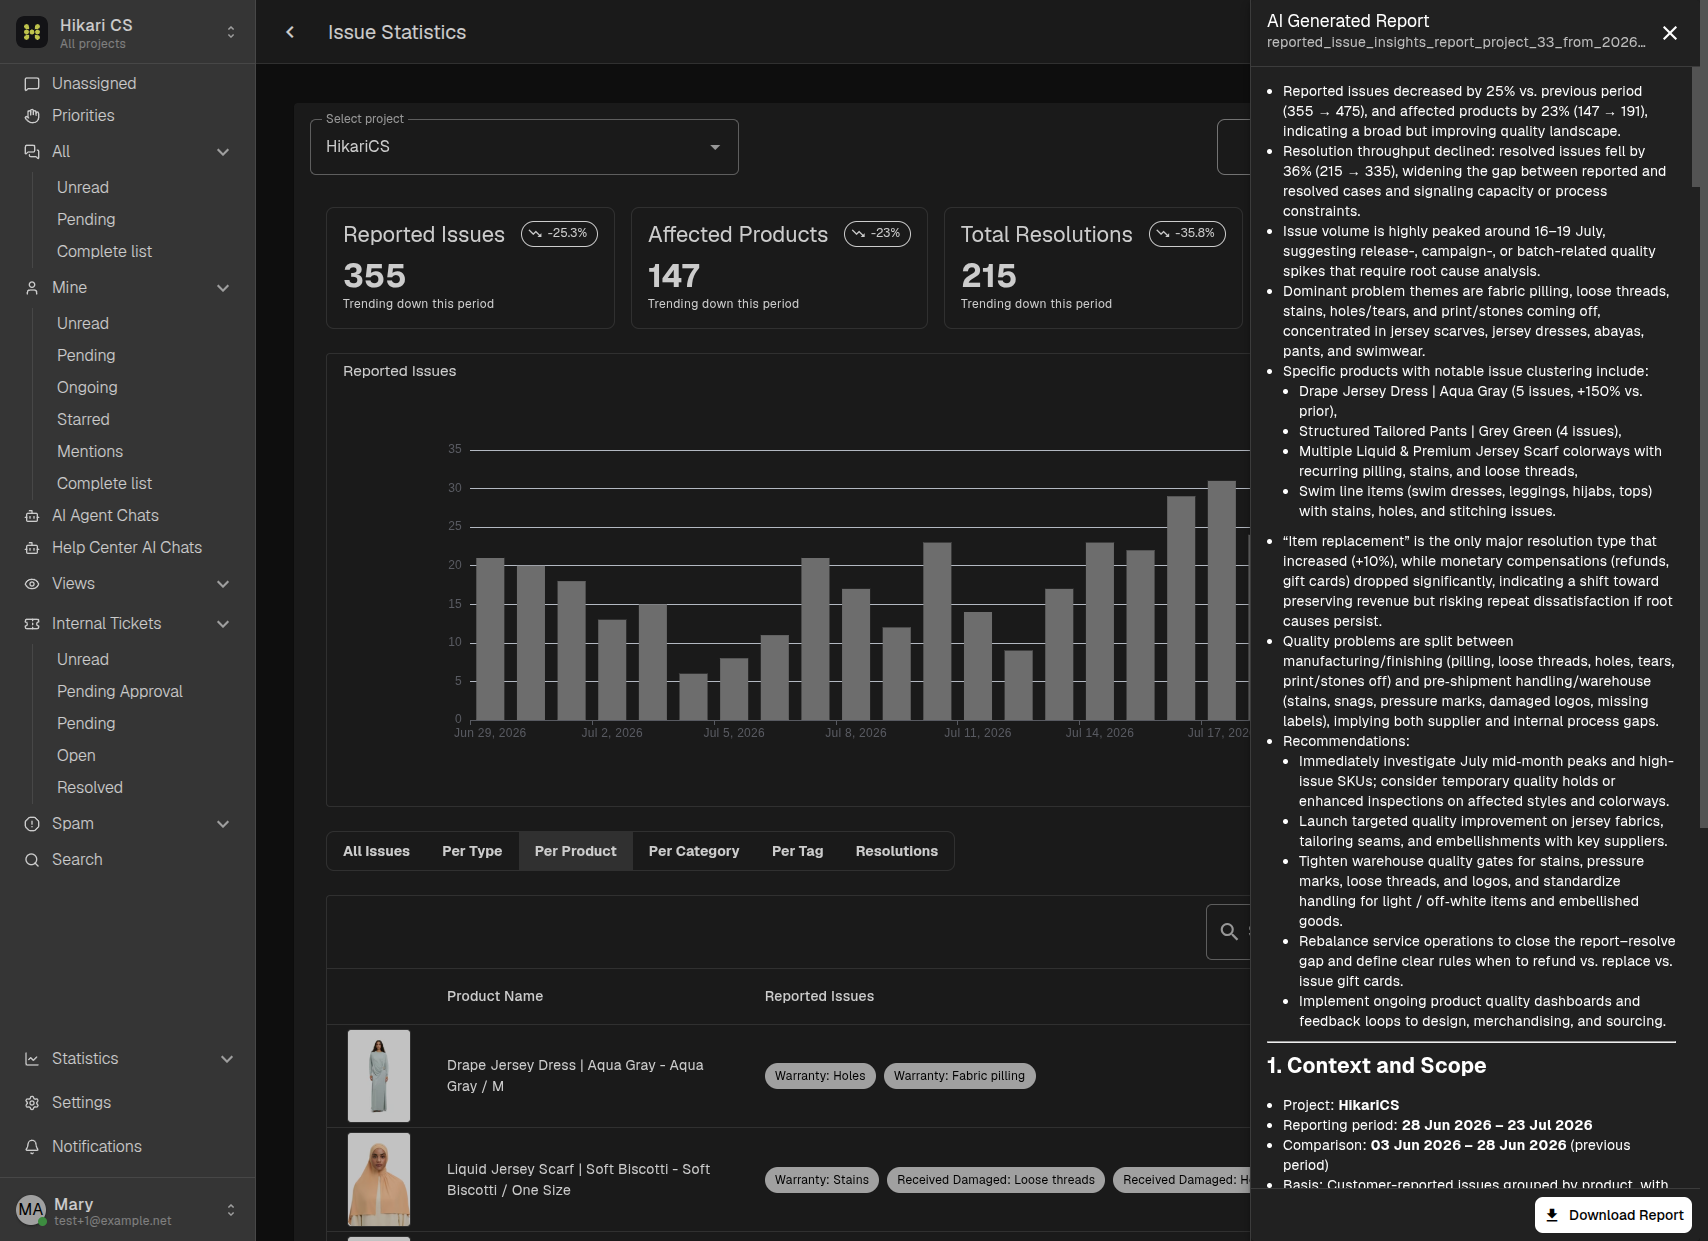
To save the report, click Download report in the bottom-right corner. The report is downloaded as a Markdown file.
To generate another report, close the drawer by clicking the X in the top-right corner and click Generate report again.
Summary
- Open Statistics > Reported issues to view the Issue Statistics dashboard.
- Filter by project and date range, then explore tabs for different views.
- Click Generate report to create an AI summary, then View report to read and download it.